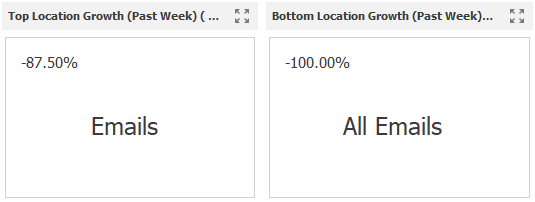
Top/Bottom Location Growth Charts
The “Top Location Growth (Past Week)” card displays information about the location with the highest percentage increase over the last week within the selected date range.
Similarly, the “Bottom Location Growth (Past Week)” card displays information about the location with the lowest percentage increase over the same period.
These cards are static (i.e. not interactive) and reflect the available data regardless of selections made in other charts.