Location Usage Summary Chart
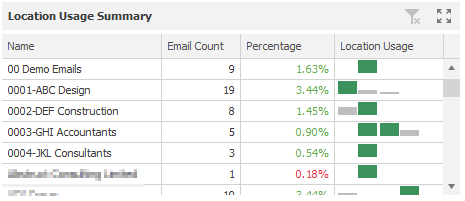
The “Location Usage Summary” grid provides a breakdown of location usage across the organisation. Details include: Name, Email Count, Percentage, and Location Usage compared to previous months.
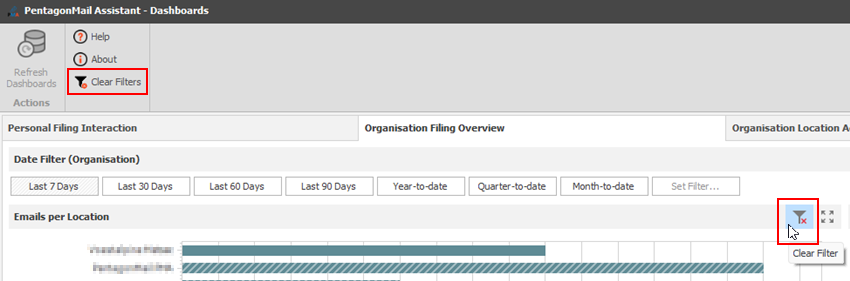
The time frame can be adjusted using the “Date Filter (Organisation)”, which is set to “Last 7 Days” by default.
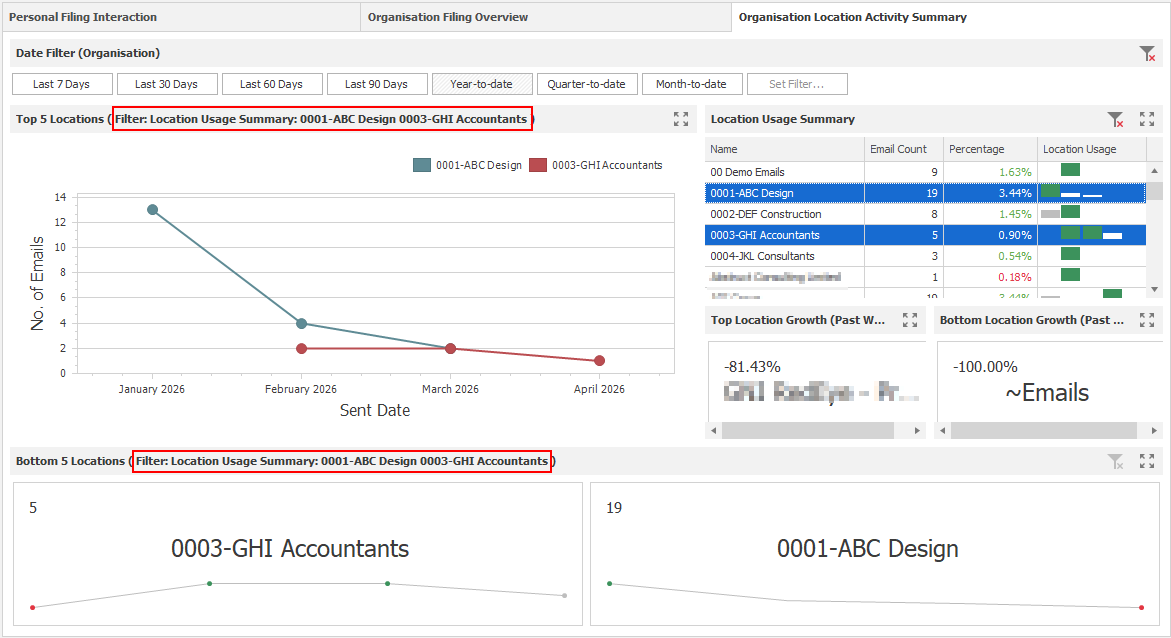
Filters can also be applied to other charts in the Organisation tabs to refine the results and display the top five locations for a specific selection.
Selecting a chart item (row) will display the location's details in the "Top 5 Locations" and "Bottom 5 Locations" charts.
Please note that all applicable charts in the "Organisation Filing Overview" tab will also be affected by this selection.
Multiple locations can be selected by holding Shift and clicking the rows you want to filter.
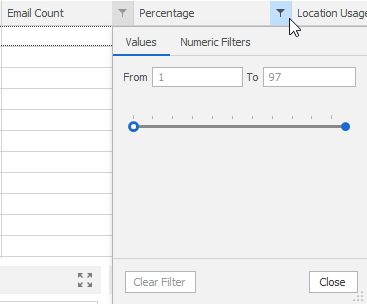
Additionally, users can filter the results by email count or percentage - for example, to remove spikes from the list.
To restore all information after filtering, you can click the “Clear Filter” button on the chart or the main “Clear Filters” button. Please note that the “Clear Filters” button removes all filters applied across all charts on both Organisational tabs, except for the “Date Filter (Organisation)”.