Top 5 Locations Chart
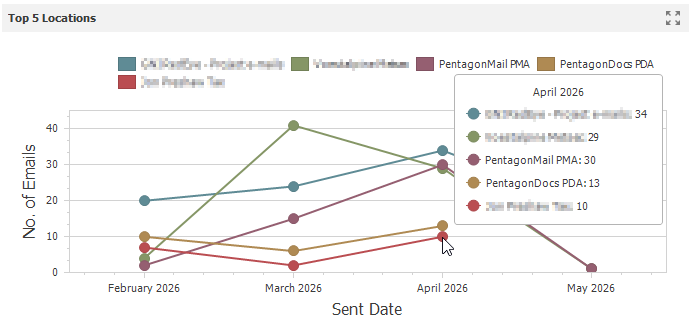
The “Top 5 Locations” chart displays the five most-used locations across the organisation. This line chart will show how many emails were filed to each location over time. The time frame can be adjusted using the “Date Filter (Organisation)”, which is set to “Last 7 Days” by default.
Filters can also be applied to other charts in the Organisation tabs to refine the results and display the top five locations for a specific selection.
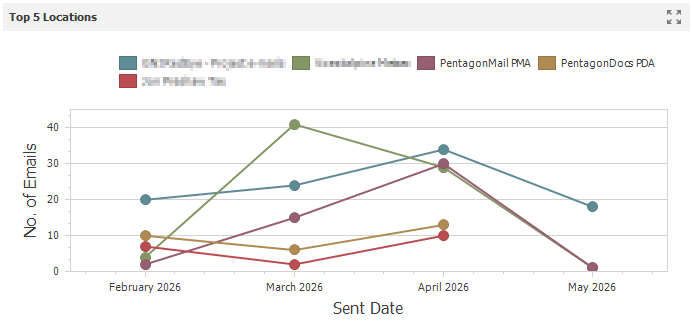
By hovering over the chart at different time periods, you can view the exact number of emails filed for each of the top 5 locations.