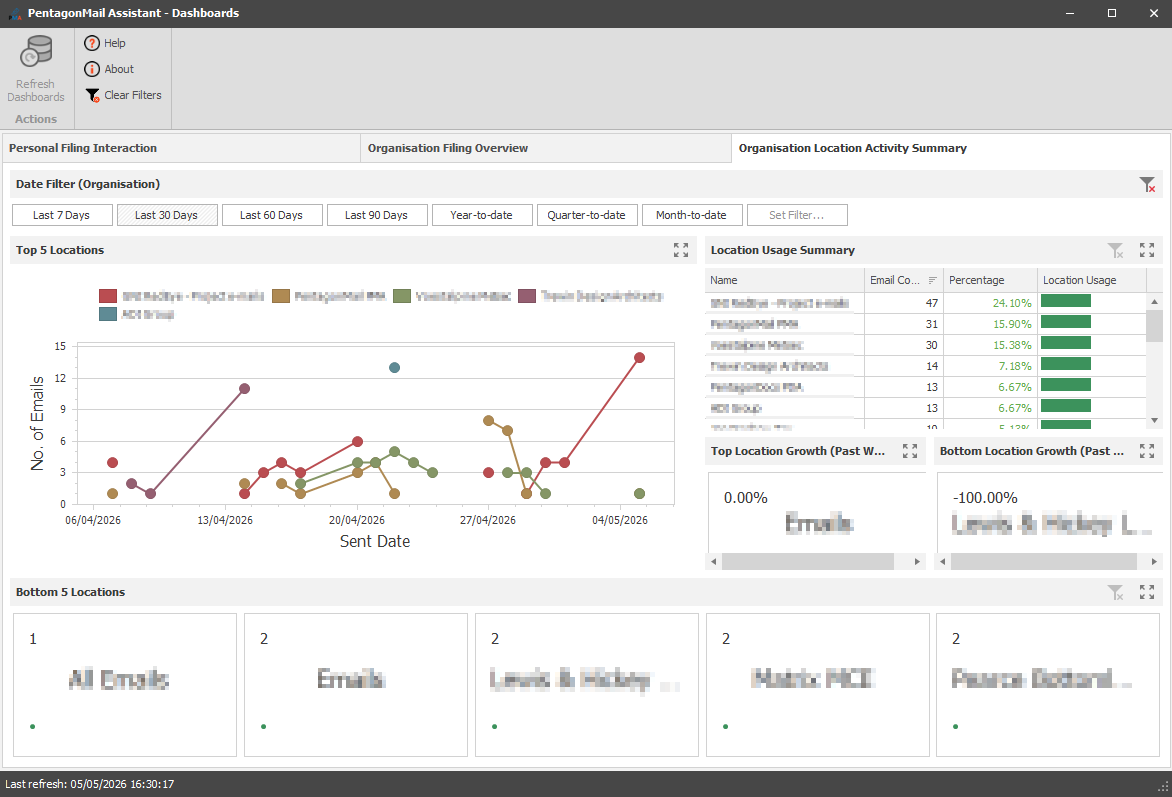
Organisation Location Activity Summary
By using the charts in this tab, users can perform a comprehensive analysis of the entire team’s email filing activity
Particular attention is given to the most and least used locations over time, helping to visualise trends and shifts in team activity.
Please note that the data displayed in these local dashboards is filtered based on the user's active PMA filing groups. This means you will not see metrics from locations you do not have access to, and you can also choose to deactivate confidential groups when reviewing this data.
The data is sourced from both the user’s personal PMA database and the PMA indexer, providing a consolidated view of organisational PMA activity.
Filters applied in this tab will also affect the charts in the "Organisation Filing Overview" tab.
For more detailed insights, please visit the dedicated pages for each chart type to explore their full functionality.