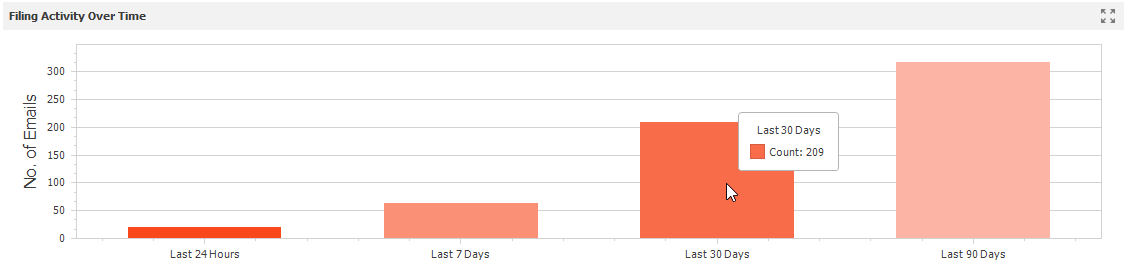
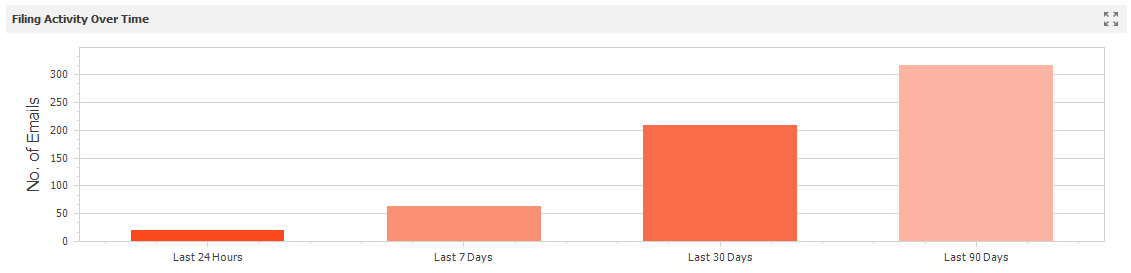
Filing Activity Over Time Chart
Filing Activity Over Time
At the bottom of the screen, a bar chart shows the number of emails sent over four different time periods: 24 hours, 7 days, 30 days, and 90 days.
By hovering over the results, the user is able to get a email count for that specific time period.