Emails Per Location Chart
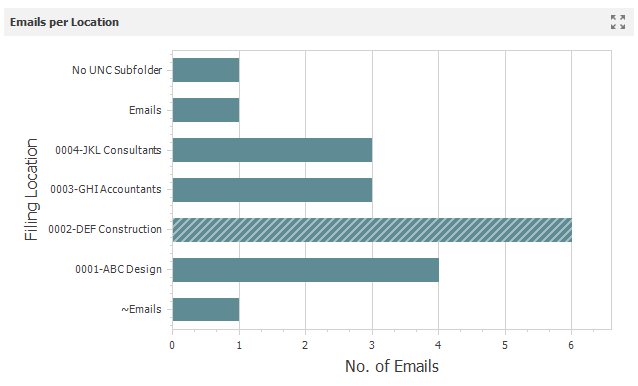
Emails Per Location
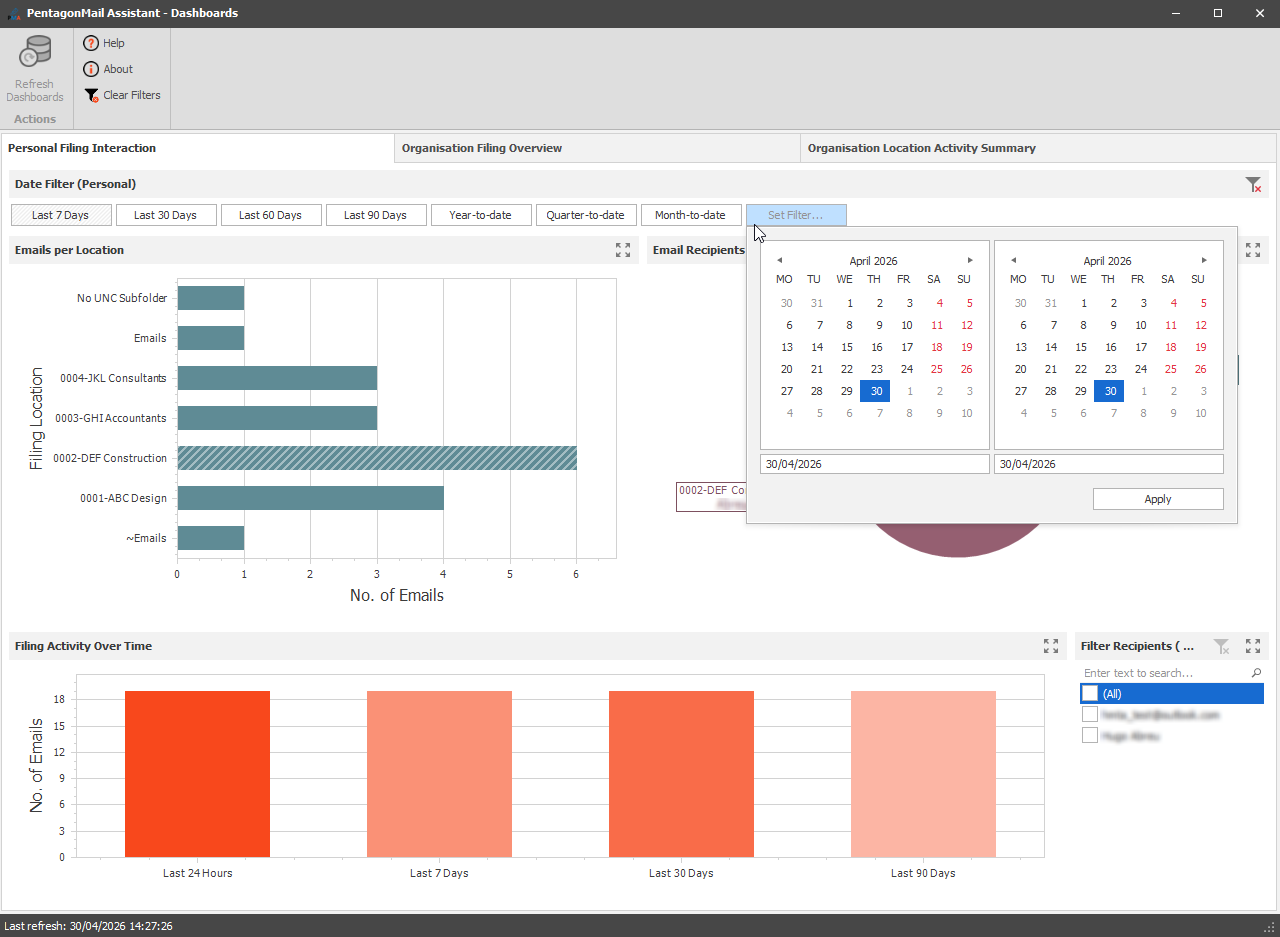
The "Emails Per Location" chart displays the number of emails sent or received in a specific location within a selected time frame. The time frame and location can be adjusted using the available filtering options.
Selecting a bar in the chart will display that location's details in the "Email Recipients" bar chart. The selected filing location is highlighted with a striped pattern.
Filtering Options
Within the dashboard there are several filtering options available. These filters apply to the Emails per Location charts. Filters include:
- Last 7 Days
- Last 30 Days
- Last 60 Days
- Last 90 Days
- Year-to-date
- Quarter-to-date
- Month-to-date
- Set Filter... (Calendar)
Applying a filter will display the relevant information for the selected option in the Emails per Location Bar Chart.